Sorry your browser is not supported!

You are using an outdated browser that does not support modern web technologies, in order to use this site please update to a new browser.

Browsers supported include Chrome, FireFox, Safari, Opera, Internet Explorer 10+ or Microsoft Edge.

Work in Progress / Pyramid Editor - (new DBPro IDE with integrated debugger)

Author
Message
Diggsey
18
Years of Service
User Offline
Joined: 24th Apr 2006
Location: On this web page.
Posted: 20th Apr 2009 21:43 Edited at: 22nd Apr 2009 01:12
This is what I've been working on the last few weeks (and the debugger on and off for the last few months!).

It's not finished yet, which is why it's a WIP, but it is completely usable as an IDE and debugger.

It was programmed in all of native C++, C++/CLR, C#.net and VB.net. Yhe code editing control was programmed from scratch by me in C#.net, and the docking on the tabs, and the resizeable panels were done by me.

Screenshots:


IMPORTANT

If your DBPro install directory is not the default, you must change it as soon as you start up, by choosing Tools->Options, and then changing the relevant field. You must then restart for the keywords to be loaded from the new directory.


Instructions for debugging

By default, the IDE will function like any other, compiling and running your projects as usual. But, if you check the 'Build->Attach Debugger' option, the next time your project is run, through 'Run Last Build' or 'Compile and Run', the IDE will attach to the executable and enter debugging mode.

(As long as the executable is up to date with the source code, you don't even need to recompile!)

When the executable runs in debug mode it will show a debug message box (click OK within a few seconds, or any breakpoints you set before the main loop won't get added before the program has already begun, and so won't be hit).

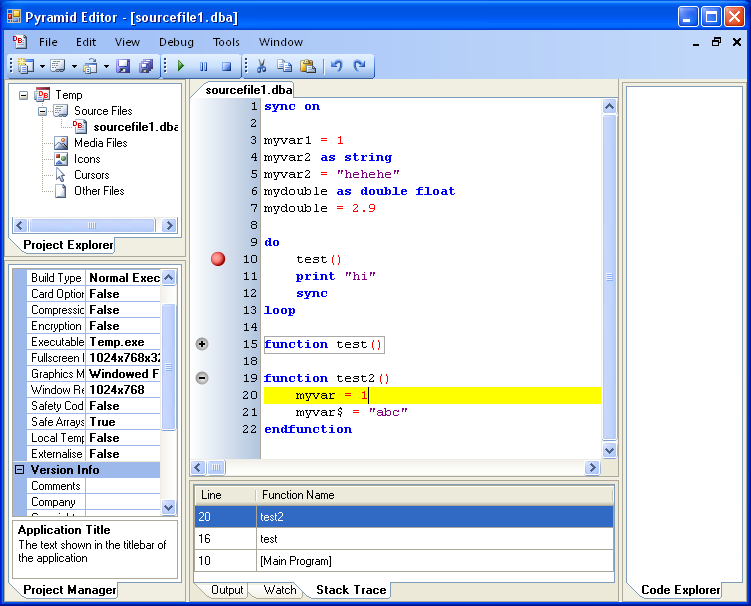
You can click to the left of the code, before the line numbers to toggle a breakpoint on that line (You can do this at any time, even before you run the program). Once the program hits a breakpoint and breaks into the debugger, you will see a yellow line in the source code. This is the current position. You can step through the code using the debug menu, or the keyboard shortcuts (shown in the debug menu).

At the bottom of the screen, there will be some tabs, showing Output, Variable Watcher, and Stack Trace.

Variable Watcher
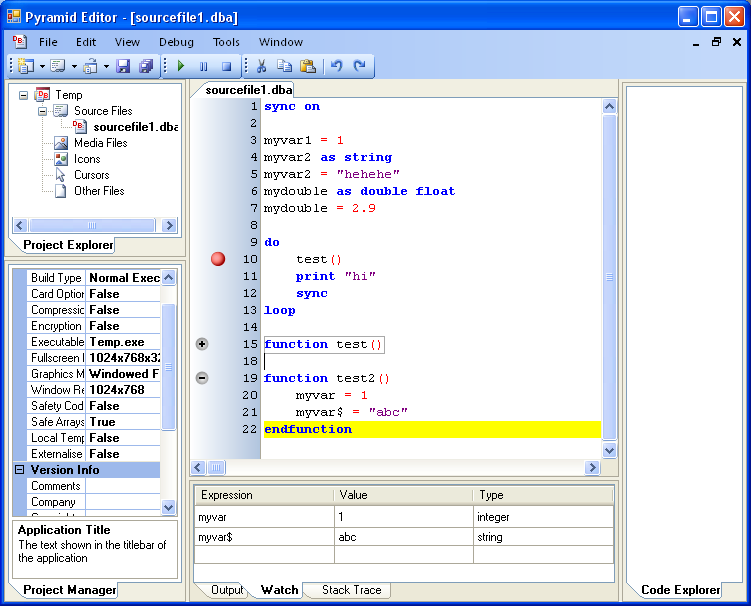
In the variable watcher, you can type in any expression including variable names, arrays, UDTs, numbers, strings, and operators, and the value and type will be evaluated according to the current stack frame, and shown to the right. If this is a reference to a real variable/array item/UDT member, the value can be modified by double clicking, and then typing a new value.

Stack Trace
The stack trace shows the functions you are in, so normally, it will just show [Main Program] indicating that your are not in any functions. If you then enter a function called 'MyFunction', it will show:

MyFunction
[Main Program]

And the deeper in you go, the more functions it will show. You can change the current frame (each item is called a reference frame) by double clicking it. The current line of execution will change to reflect the new frame, so in this example, if you double-click '[Main Program]' it would be over the line that called 'MyFunction', and would be green, indicating that it is not the top-most frame in the stack.

Changing the frame also changes the scope in which variable names are evaluated.


Other features:
- Plugin system
- Custom editors can be associated with other file types, and used within the IDE (through the plugin system)
- Collapsible functions
- Semi-dockable interface, made by me, which remembers your preference (You can drag tabs between tab controls, but you need to resize the borders yourself by dragging them).

Requirements
- It does use the font 'Segui UI' in some places, which comes as default with windows vista, and also with newer versions of office and visual studio, but if you don't have it, you can either use the nearest matched font, or download it (it's free, and looks great)

- It requires at least version 2.0 of the .net framework to be installed on your computer.


Anyway, it's difficult to explain everything, but you can try it out for yourself with the download!

You may have noticed that the icon is the standard .net one. If you want to be of any help, I really need a good icon, or icons, that will look good at these resolutions: 16x16, 32x32 and 48x48. They should be 32 bit with alpha, and I can convert them from any image format to .ico, but png is preferred.

edit:
THE DOWNLOAD IS FIXED!

Attachments

Login to view attachments
IanM
Retired Moderator
21
Years of Service
User Offline
Joined: 11th Sep 2002
Location: In my moon base
Posted: 21st Apr 2009 00:52 Edited at: 21st Apr 2009 00:57
Immediate crash when I run it:


I'm running Vista SP1 with all the latest patches, but excluding Silverlight.

I basically dumped all of the files from the zip into a new folder and double-clicked the exe.

[EDIT]
Ignore me - I though I had .NET 2.0 installed, but it appears that I don't. Give me a while to install it and check it out.

[EDIT2]
Nope, the installer tells me that .NET 2.0 is already installed. In that case, erm... your editor crashes

Diggsey
18
Years of Service
User Offline
Joined: 24th Apr 2006
Location: On this web page.
Posted: 21st Apr 2009 01:04
I uploaded a new version, I believe I missed some dlls out last time, but they shouldn't have caused the immediate crash you experienced

Anyway, it may have fixed it.

Roxas
18
Years of Service
User Offline
Joined: 11th Nov 2005
Location: http://forum.thegamecreators.com
Posted: 21st Apr 2009 01:04
That looks better than any dbpro IDE yet, with useful features.
Good work Diggsey!

Sad it will be no use for me

IanM
Retired Moderator
21
Years of Service
User Offline
Joined: 11th Sep 2002
Location: In my moon base
Posted: 21st Apr 2009 01:20 Edited at: 21st Apr 2009 01:20
It still crashes.
There didn't appear to be any new files included, but the 'PyramidEditor.vshost.exe' isn't included in this zip file.

It appears to be exactly the same problem


When I kick it into the VS debugger I get this:
Quote: "An unhandled exception of type 'System.IO.FileLoadException' occurred in System.Windows.Forms.dll

Additional information: Could not load file or assembly 'ManagedDebugger, Version=1.0.3397.31327, Culture=neutral, PublicKeyToken=null' or one of its dependencies. The application has failed to start because its side-by-side configuration is incorrect. Please see the application event log for more detail. (Exception from HRESULT: 0x800736B1)"


Maybe that'll help.

Michael P
18
Years of Service
User Offline
Joined: 6th Mar 2006
Location: London (UK)
Posted: 21st Apr 2009 20:52 Edited at: 21st Apr 2009 21:03
It looks very good but I have the same problem as IanM on Windows XP SP3 with .NET v3.5 installed. I am happy to keep testing new releases until you find out what the problem is .

Here is a screenshot of the error signiture:


Attachments

Login to view attachments
Serial Velocity
15
Years of Service
User Offline
Joined: 24th Aug 2008
Location:
Posted: 21st Apr 2009 22:00 Edited at: 21st Apr 2009 22:03
I tried it out but unfortunately I get a "stopped working" error. I tried running in Administrator Mode and Compatability Mode for XP SP2 but I get the same thing. Im using Windows Vista SP1 with .NET 3.0 installed if that helps.


Looks great and I cant wait to be able to try it out

Attachments

Login to view attachments
Diggsey
18
Years of Service
User Offline
Joined: 24th Apr 2006
Location: On this web page.
Posted: 21st Apr 2009 22:29 Edited at: 21st Apr 2009 22:52
Does installing this help?

edit:
I ran dependency walker on it, and it shows two MSVCR80.DLLs, one of which is not found, and the same for MSVCR80D.DLL. Oddly, the dlls which depend on those not found dlls have the same version as the versions of those found dlls... Is this the same as what you got?

Attachments

Login to view attachments
Michael P
18
Years of Service
User Offline
Joined: 6th Mar 2006
Location: London (UK)
Posted: 21st Apr 2009 23:01
That did not help me, I got the same problem.

Diggsey
18
Years of Service
User Offline
Joined: 24th Apr 2006
Location: On this web page.
Posted: 22nd Apr 2009 00:42
I read that Vista is supposed to give a lot more error information about side-by-side errors, so could someone running vista test it, and then tell me what it shows in the event viewer: http://www.computerperformance.co.uk/vista/vista_event_viewer.htm

That would be really helpful, thanks!

Diggsey
18
Years of Service
User Offline
Joined: 24th Apr 2006
Location: On this web page.
Posted: 22nd Apr 2009 01:01
Don't worry, I think I've fixed it now
You can download from the top post.

(I was compiling in release mode, but the link directory for one of the projects was still set to the debug output folder, and so the debug libraries were included, and not many other people have the same version of the debug libraries as me!)

Michael P
18
Years of Service
User Offline
Joined: 6th Mar 2006
Location: London (UK)
Posted: 22nd Apr 2009 01:05
It works for me now I was able to compile a simple hello world application, I'll have a more detailed look tomorrow.

Diggsey
18
Years of Service
User Offline
Joined: 24th Apr 2006
Location: On this web page.
Posted: 22nd Apr 2009 01:08
YAY!!!

Thanks for being so patient

Diggsey
18
Years of Service
User Offline
Joined: 24th Apr 2006
Location: On this web page.
Posted: 27th Apr 2009 01:55
Anyone tried out the debugger?

Phjon
18
Years of Service
User Offline
Joined: 28th Nov 2005
Location:
Posted: 3rd May 2009 00:09
Diggsey,

Sorry I haven't been able to test this lastest incarnation of the debugger/IDE out until now; I've been tied down with revision and will be for the rest of this month or so.

I've been waiting to test your lastest version of the debugger; I have taken a good look at this version, and things seemed to have moved forwards a bit since I looked at the "early" version of it last year, although some things seem to have moved backwards. I've done a list of things both major and minor that I've encountered so far:


IDE/UI issues


1. Tools -> Options -> DBPro root directory "Browse" button
The tree view menu in here only seems to show the "Program Files" folder and its subfolders and files

2. Tools -> Options
No other main tabs on the left seem to be functional at the moment.

3. When clicking elsewhere other than the code window, the caret is still present (i.e. the sub-window does not have the focus but "appears" to have focus). This could be a little confusing.

4. Breakpoint selection by mouse seems to only be possible when one clicks in an invisible coloumn the width of the breakpoint circles. It would be nice if one could click anywhere in the "line number coloumn".

5. It would be useful if the "Step" based commands had their own buttons on the toolbar next to the "Compile" buttons.

6. File -> Export Templates and File -> Recent Projects do not have any effect when clicking on them. Same thing with the "View" menu tab.


Debugger issues


1. When selecting "Compile and Run" or the combination "Comple only" then "Run last build" buttons...
...and then after the "Compiling..." box vanishes...
...a message appears.

Title:
"DBP App has deposited the glob struct in the filemap as a DWORD, and now wants to OWN this mutex...give it to me!"

Message:
"D__Dark Basic Professional_Projects_Test Program for New DBPro Debugger_Test Program for New DBPro Debugger.exe(Mutex)"

Is this message part of normal operations?


2. Following the error message there is a long wait of about 5.3 seconds.

At this time, I do not know if the waiting time is proportional to other factors such as code length/number of breakpoints/etc...

I thought the program had crashed to begin with...it would be useful if there was some sort of progress bar in place here.


3. Closing the DBPro exe does not stop the debugger from running, or vice versa. They must be stopped separately.

3A. Closing the DBPro exe first, and then pressing "Break All" or "Stop Debugging" crashes the IDE

3B. Stopping the debugger first and then pressing "Compile and Run" causes the compiler to crash.

Idealy they should either cease simultaneously, or buttons/menu commands could be greyed out to prevent users from pressing them and causing the above crashes.


4. With breakpoints in place.

When the debugger breaks on a breakpoint, and the IDE is maximised, the DBPro exe window does not reappear over the IDE if it is selected in the windows taskbar.


5. Variable watch window.

One cannot copy/paste text from the code window to the watch window.

Using the watch window in conjunction with the debugger and IDE operations causes crashes or complier errors. More investigations needed here on my part or someone else's to track them down.

Question: Why is this method of typing in variable names used for the watch window, when in the "early" version, all were recognised automatically by the IDE/debugger?

I haven't been able to do a more extensive test of features at this time, but I will try and help out with the testing work and suggestions where and when I can; I just don't have a huge amount of spare time at the moment.

Keep up the good work.
Diggsey
18
Years of Service
User Offline
Joined: 24th Apr 2006
Location: On this web page.
Posted: 3rd May 2009 02:58
IDE issues:
1. Will fix
2. Not done yet
3. Will fix
4. Will widen column, a bit is needed for full line selection
5. Will add, currently you can use the hotkeys to do it quickly
6. Not done yet

Debugger issues:
1. That is normal, it was put in place by Lee to aid me in testing the debugger (there is some communication between the debugger and the app, and that message is the app acknowledging that the debugger is attaching).
2. The pause is either to do with some sleep commands in the app when the debugger attaches, or is just the time taken to attach.
3. Stopping debugging using the IDE should detach the debugger and the DBPro app should continue as normal. I will fix both 3A and 3B.
4. That is because the app has hit a breakpoint, and so all code is paused. If no code can run it cannot respond to any events, or redraw itself. You will find this behaviour in every debugger.
5. Will look into the copy/paste issue. Watch window doesn't cause crashes or errors here, will look into it. What 'early' version was that? No version I've made has ever automatically loaded the variables. Eventually you will be able to just mouse-over a variable in the code to see its value. Just to note, the watch window supports full expressions as well as names)

feiting shadow
17
Years of Service
User Offline
Joined: 12th Sep 2006
Location:
Posted: 4th May 2009 05:17 Edited at: 4th May 2009 05:18
Hey, you know what annoys me about DB's editors? You can only add one media file at a time to an exe (when you want to compile it all as one). So more than one would be nice, or whole Dir's even, or both.

So if yours does that, I may be persuaded out of using the other ones...

In fact, I'd probably fall in love (with the editor), and donate some money your way, just as soon as my income comes back. (hopefully soon)

Signed
------
BMacZero
18
Years of Service
User Offline
Joined: 30th Dec 2005
Location: E:/ NA / USA
Posted: 4th May 2009 06:27 Edited at: 4th May 2009 06:56
Coolness! I'm trying it out right now, mainly the debugger. If it works well for me, you might have a convert . I've managed to crash it once so far, but I'm still trying stuff.

EDIT:

Two pretty minor suggestions/bugs at this point:

1.) Would it be possible to make the main source file open automatically when you open a project?

2.) When I hit Ctrl-s, it inserts an unrecognized character into the code .

Also, I'll see if I can work on an icon for you .


BMacZero
18
Years of Service
User Offline
Joined: 30th Dec 2005
Location: E:/ NA / USA
Posted: 4th May 2009 17:07 Edited at: 12th Sep 2009 01:49
Okay, do these icons work for you?

(Attached)


Attachments

Login to view attachments
Diggsey
18
Years of Service
User Offline
Joined: 24th Apr 2006
Location: On this web page.
Posted: 5th May 2009 18:58
That's great, thanks

I will include them with the next update.

BMacZero
18
Years of Service
User Offline
Joined: 30th Dec 2005
Location: E:/ NA / USA
Posted: 8th May 2009 00:19
I just realized what this is mainly missing - help file access! This seems quite important to me, and is definitely another aspect of IDEs that could see some improvements as far as searching, etc. I hope you have plans for this .

One other minor annoyance I have discovered in my testing is the inability to open project files from Explorer with Pyramid. You have to open the editor and use File->Open.

Just throwing more stuff out there .


Login to post a reply

Server time is: 2024-05-16 16:39:44
Your offset time is: 2024-05-16 16:39:44